Why DevOps Monitoring Observability Matters: Ensuring Reliability in Modern Cloud Environments
In today’s world of microservices, dynamic cloud environments, and continuous deployment, software systems have become more distributed and complex than ever before. Traditional troubleshooting and performance practices simply can’t keep up. This is where DevOps monitoring observability becomes essential.
Monitoring and observability are no longer operational add-ons; they are strategic capabilities that enable engineering teams to understand system behavior, prevent failures, optimize performance, and support business growth. When implemented effectively, they directly improve reliability, accelerate development, and enhance customer experience.
Understanding Monitoring vs. Observability
Although often used interchangeably, DevOps monitoring observability serve different but complementary functions in a workflow.
Monitoring
Monitoring focuses on collecting and analyzing predefined metrics and logs to evaluate system performance. It answers the question:
“Is the system operating as expected?”
Key elements include:
- Dashboards to visualize system health
- Alerts for KPIs such as CPU, memory, latency, error rates, and throughput
- Real-time performance tracking and incident detection
Monitoring is ideal for identifying known issues and validating system behavior against expected performance thresholds.
Observability
Observability, on the other hand, measures how well engineers can understand the internal state of a system using its external outputs. It goes beyond dashboards and alerts, enabling the team to explore unknown issues and uncover hidden system behavior.
It empowers teams to ask questions like:
“Why is the checkout flow suddenly slowing down?”
Observability relies on rich telemetry across:
- Metrics
- Logs
- Distributed traces
Together, they help pinpoint root causes quickly crucial in DevOps monitoring observability strategies.
The Pillars of Observability in Modern DevOps
In cloud-native and microservices architectures, observability is not optional, it is foundational. Systems must emit detailed telemetry to support rapid troubleshooting, proactive improvement, and reliable performance.
1. Metrics
Metrics track system performance over time and enable:
- Real-time dashboards
- Trend analysis
- Automated alerts
Examples include CPU load, memory consumption, error ratios, and latency percentiles.
2. Logs
Logs record system events and provide deep operational insight. Structured logs (e.g., JSON format) make searching, filtering, and correlating events easier, speeding up debugging and incident investigations.
3. Traces
Distributed tracing follows requests across multiple services, APIs, and databases, crucial for identifying bottlenecks and latency issues in microservices architectures.
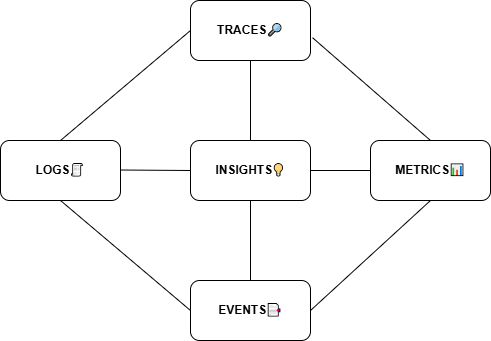
Traditional Pillars vs Modern Signal Expansion
Traditional View: 3 Core Pillars
For years, the observability model has been built around three primary pillars:
- Logs
- Metrics
- Traces
These remain the widely accepted foundation for understanding system state and troubleshooting complex environments.
Modern Trend: Events as an Additional Signal
With evolving DevOps practices, orchestration tools, and CI/CD pipelines, many modern observability platforms also incorporate Events as a key signal type.
Events include:
- Code deployments
- Configuration updates
- Scaling activities
- Security or system alerts
While Events are not universally recognized as a formal fourth pillar, they play a critical supporting role. They provide valuable context that helps teams correlate changes with system behavior, especially during rollouts, incidents, and performance shifts.
Enhancing Reliability and Performance Through Proactive Insight
The primary goal of DevOps monitoring observability is to shift from a reactive fire-fighting posture to a proactive, data-driven engineering culture.
Faster Mean Time to Detection (MTTD) and Resolution (MTTR) are direct benefits. Sophisticated alerting based on SLOs (Service Level Objectives) can notify teams of deviations before they become outages. When an incident does occur, the ability to dive deep with distributed traces and correlated logs drastically reduces the time spent searching for a root cause.
Furthermore, these practices are integral to Continuous Delivery and Safe Deployments. By implementing canary releases and blue-green deployments, teams can use real-time observability data to compare the performance and error rates of a new release against the old one. If a canary shows a spike in latency or errors, the deployment can be automatically rolled back, minimizing user impact.
Performance optimization becomes a continuous, data-informed process. Instead of guessing where bottlenecks lie, engineers can use tracing data to visualize the critical path of a request and identify the specific service or database query causing slowdowns. With DevOps monitoring observability, performance tuning becomes data-driven. Teams can trace slow requests, identify problematic services or queries, and resolve issues before users are impacted.
Implementing an Effective Observability Strategy
Adopting monitoring and observability requires more than just tooling; it requires a cultural and strategic shift.
- Instrumentation First: Code must be instrumented to emit logs, metrics, and traces from the start. This should be a standard part of the development lifecycle.
- Correlation is Key: Tools must be able to correlate data across the three pillars. Seeing a spike in error metrics should allow an engineer to click through to the relevant logs and traces for that time period instantly.
- Define SLOs and SLIs: The practice is guided by business objectives. Service Level Indicators (SLIs) are the measured metrics (e.g., latency, availability), while SLOs are the targets for those metrics. This creates a clear, data-backed definition of “reliable enough.”
- Choose the Right Platform: Modern organizations leverage unified observability platforms (e.g., Datadog, New Relic, Grafana Stack, Dynatrace) that bring metrics, logs, and traces into a single pane of glass, enabling the powerful correlation needed for deep insights.
Conclusion
In modern DevOps, the speed of development is meaningless without the parallel ability to understand and control the software in production. DevOps monitoring observability bridges the gap between development and production, transforming unknown problems into actionable insights.
They transform the “unknown unknown” into the “known known,” empowering teams to build more resilient systems, ship code with confidence, and deliver a superior user experience. From startup to enterprise, investing in a robust observability practice is not just an operational necessity, it is a fundamental competitive advantage in the digital economy.